Inventory Management KPIs You Need to Know

KPIs (Key Performance Indicators) are a great way to assign importance to departmental tasks that matter to company-wide performance. Various KPIs outline a company's efficiency and the management status of business functions. From logistics to finance, operations, sales, and inventory management, statistics for a specific KPI will provide a numerical depiction of how that department is doing. Every industry has its unique set of metrics that are more relevant to the company's performance. However, there are some inventory management KPIs that could be employed across the industry.
In this article, we outline what those inventory management KPIs are and why they are necessary to keep track of.
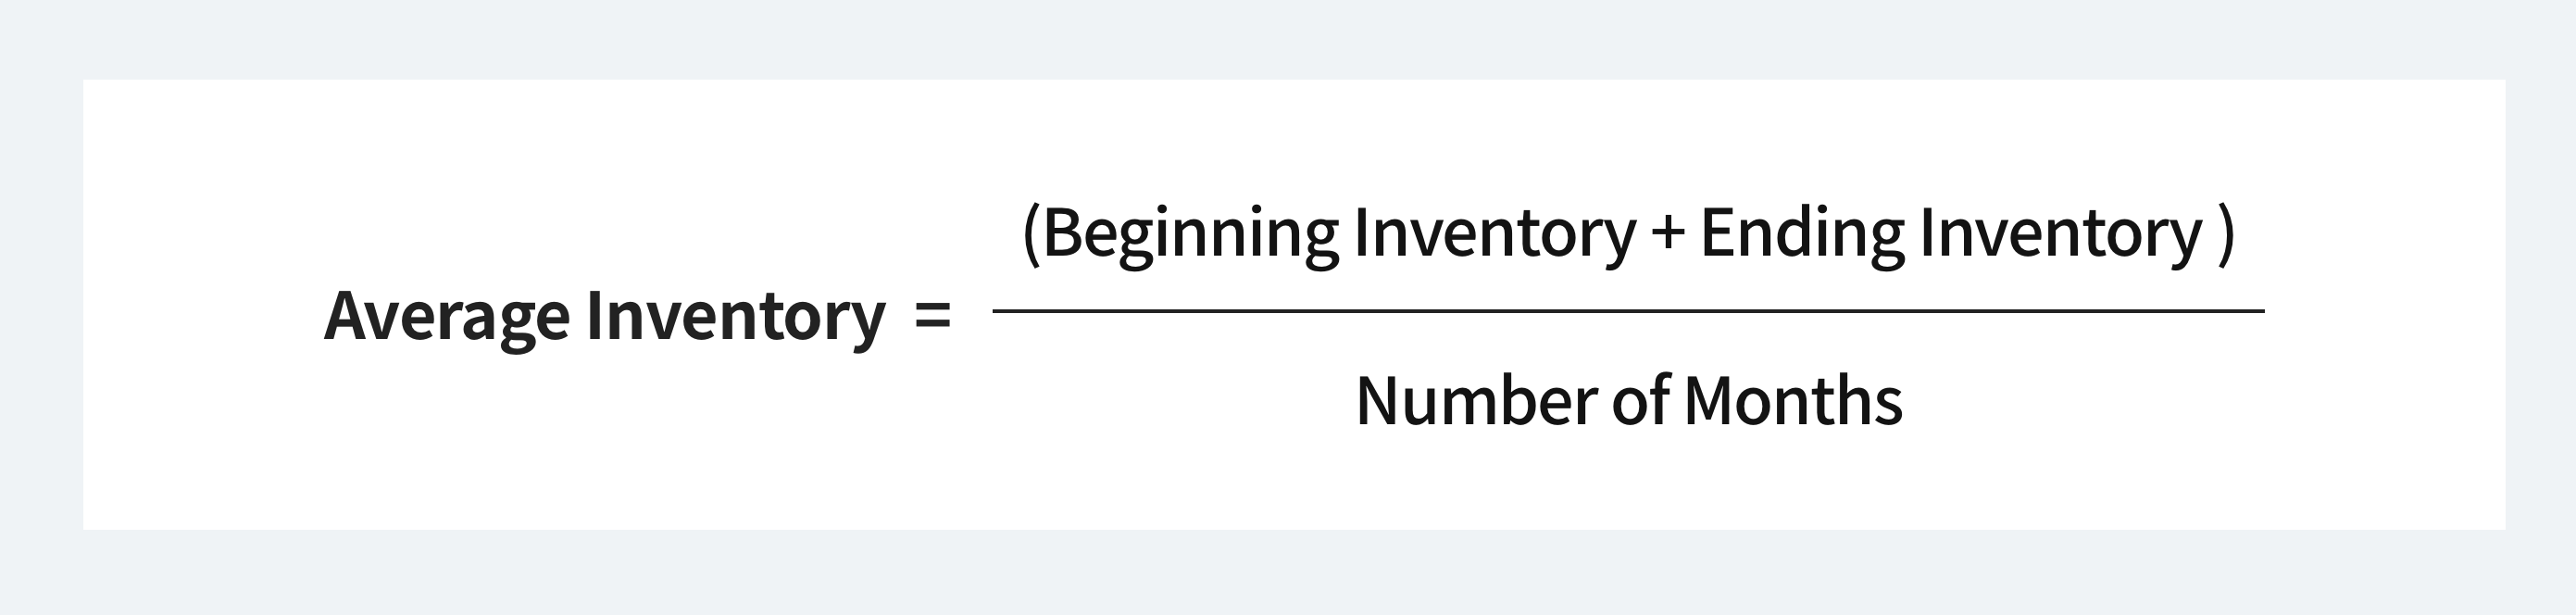
Average Inventory
The average count of inventory during two or more specific intervals. The average inventory, which is calculated by dividing the beginning inventory plus the ending inventory by the number of months, helps to show the fluctuation in inventory. Alone, the average inventory number is just a metric but is a necessary value when used to compare with other metrics and formulas.
Inventory Turnover Ratio
One of the more important statistics for inventory analysis. The ratio shows how frequently an SKU is sold, used, and replaced during a given period.
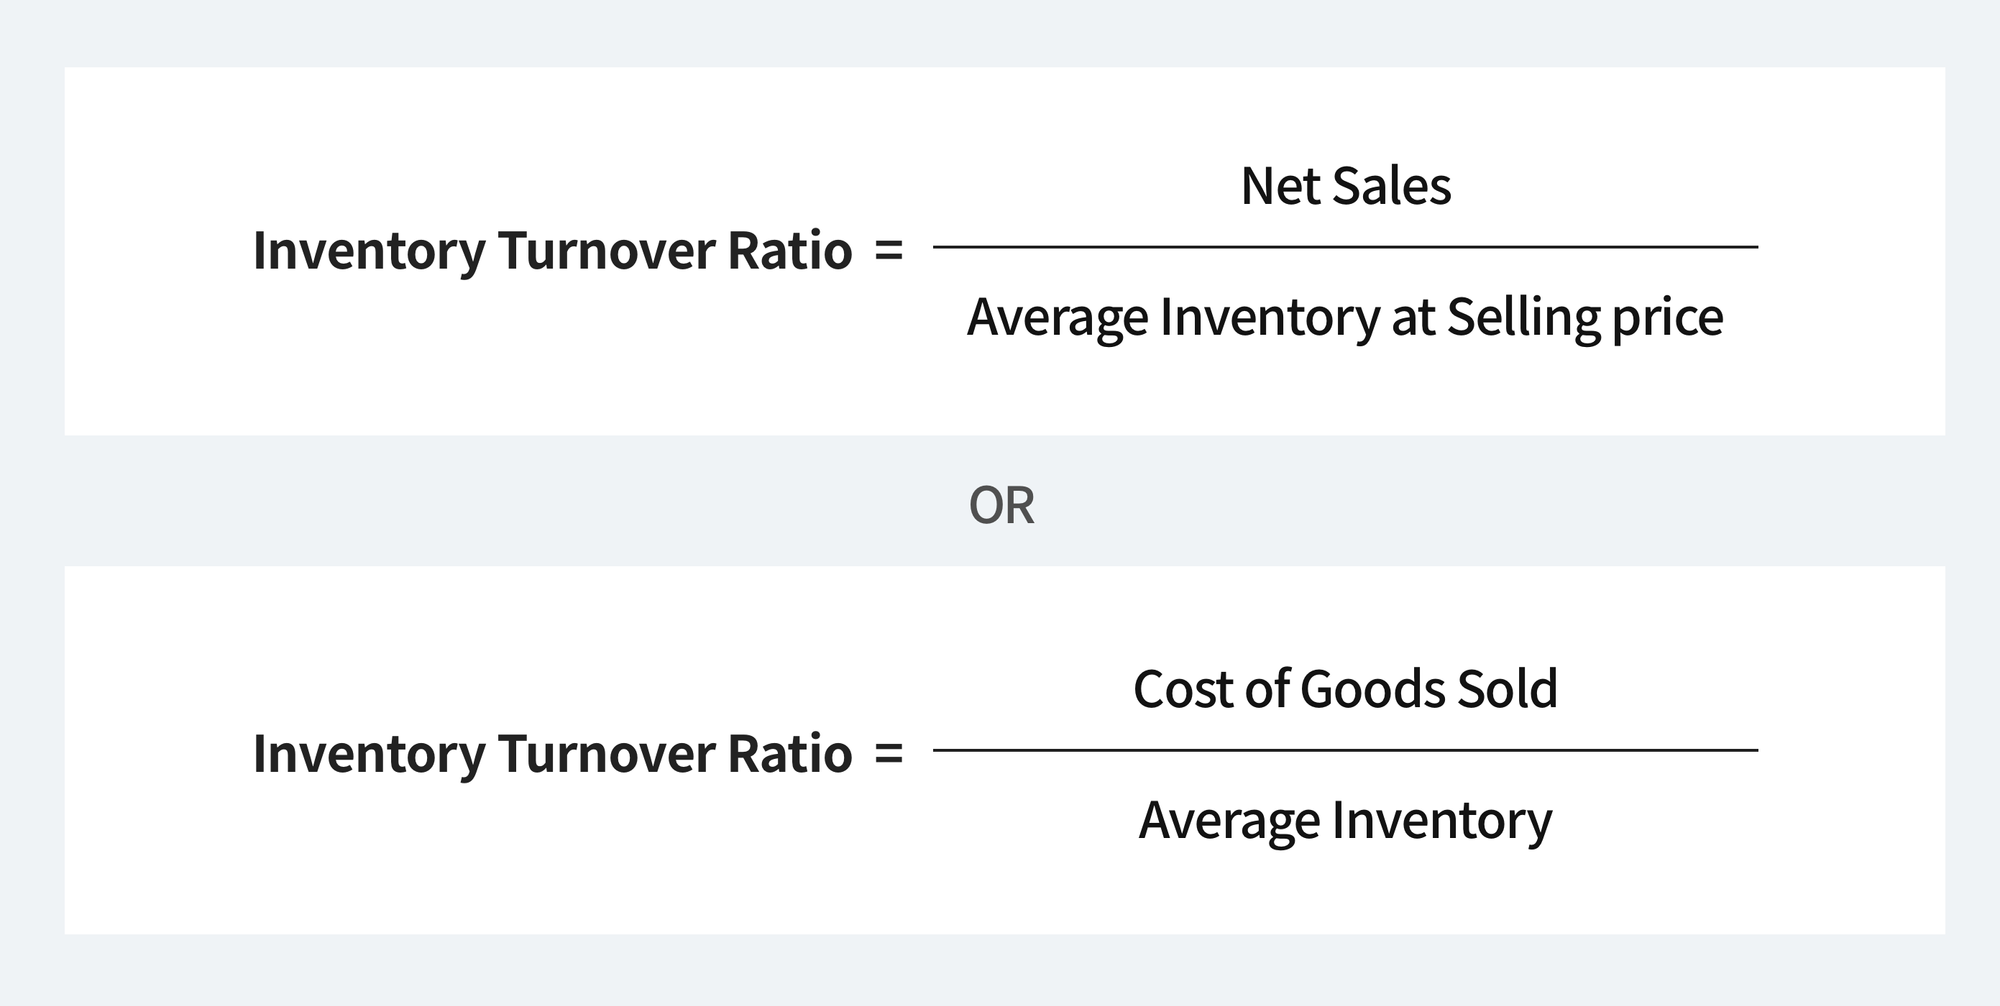
A higher ratio is a sign that your company’s sales are strong and you are moving products continuously. A lower ratio usually represents slow sales and longer inventory hold times.
Back Order Rate
Shows the percentage of products that needed to be back ordered due to high demand.
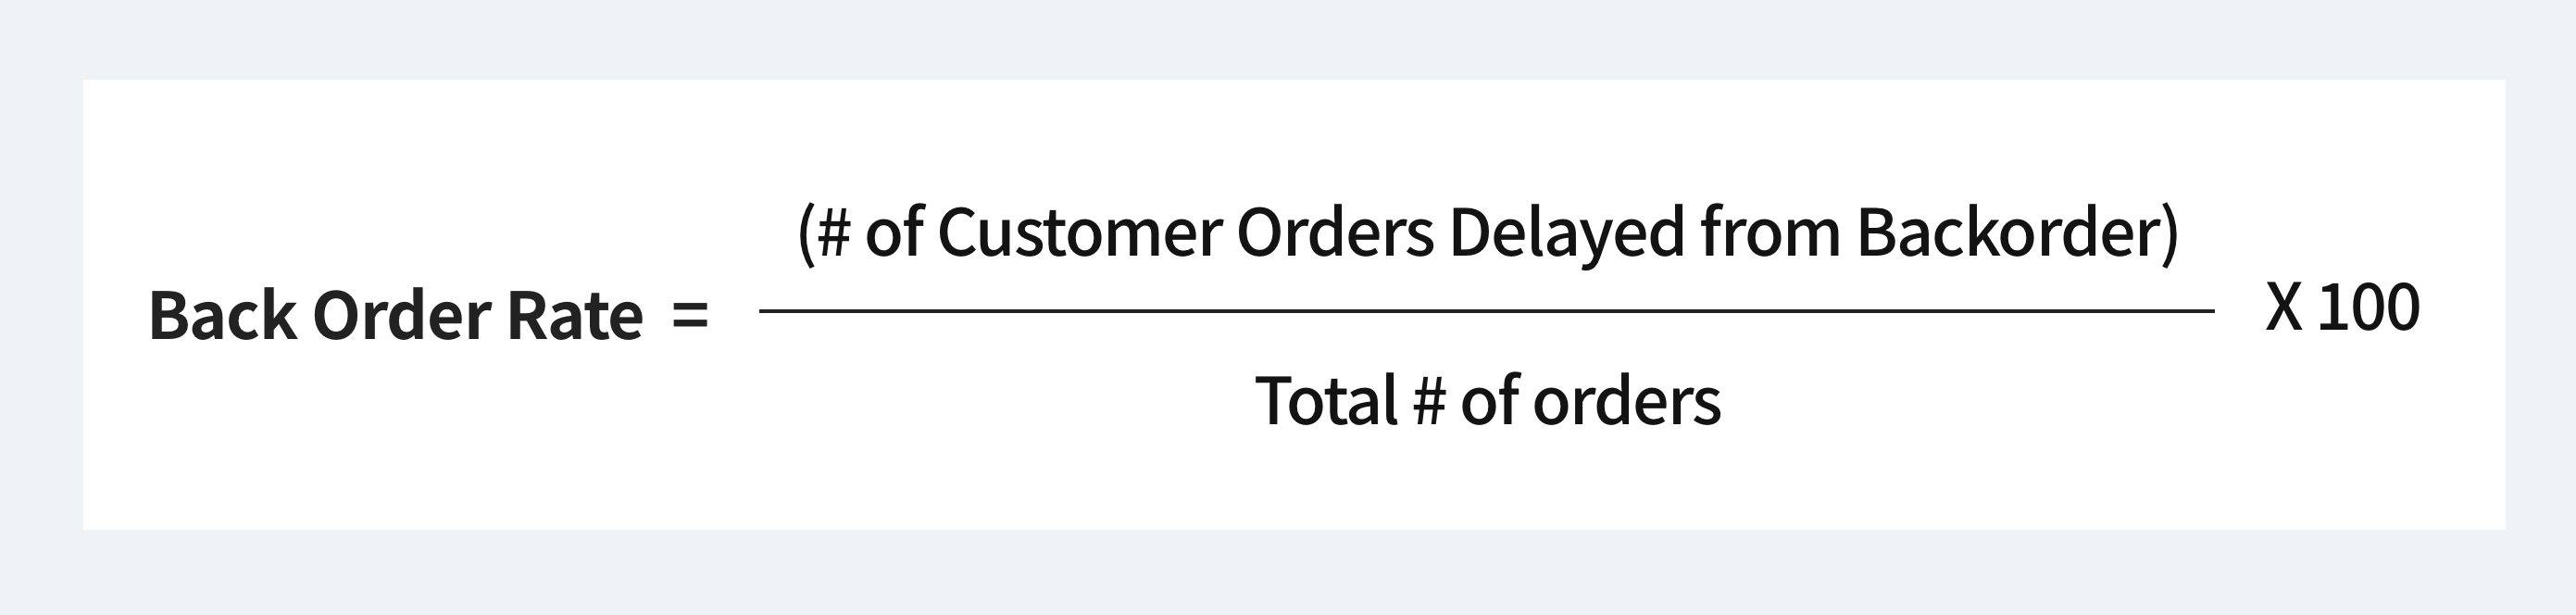
Although having a high rate shows that you have a lot of demand, it could also mean you have insufficient data for forecasting demand planning and needs to be reevaluated. Lower rates usually indicate a slow ordering cycle and the possibility of high customer dissatisfaction.
Days Sales of Inventory (DSI)
The DSI metric is used to determine the efficiency of sales and inventory management processes.
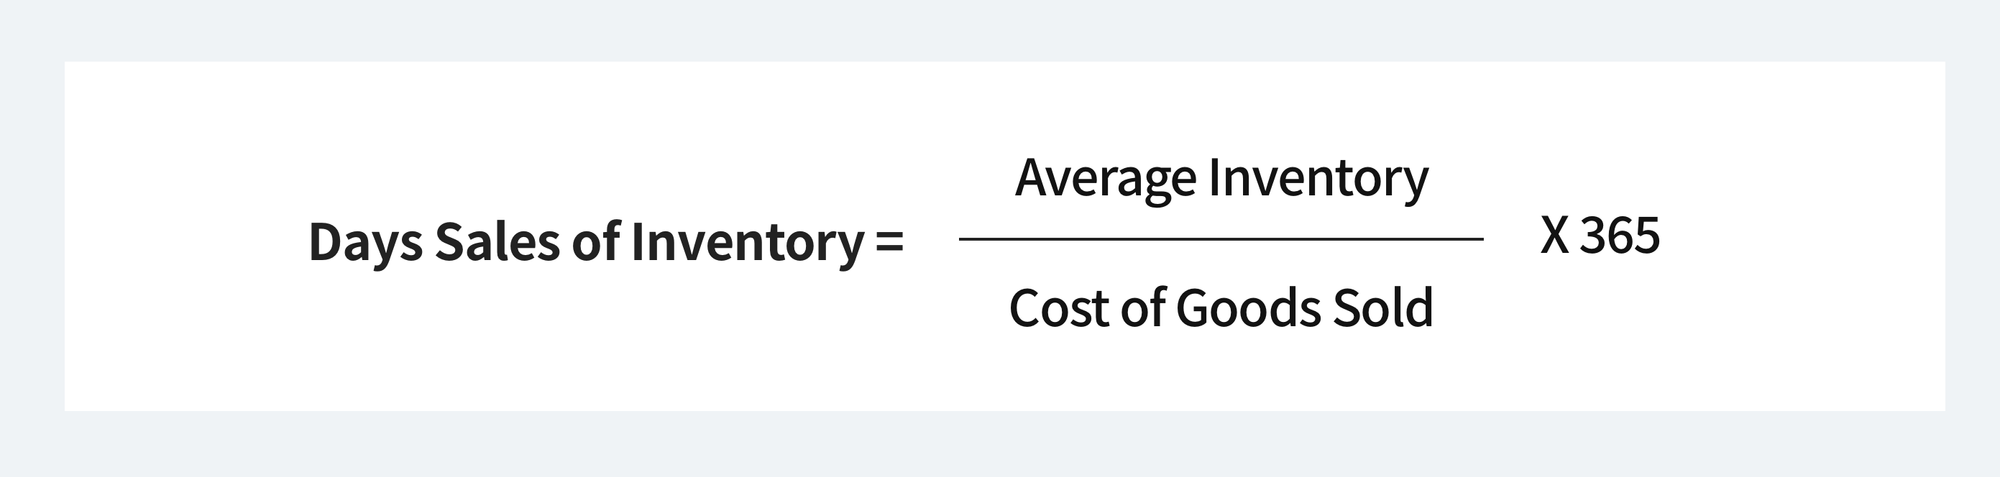
The days-to-sell metric gives the time it takes for inventory to sell. Higher numbers tend to implicate inefficiency whereas lower numbers show that inventory is moving faster. Typically companies will want to sell inventory within the next 90 days before it starts costing more money to store them.
Stock to Sales Ratio
Also known as Inventory to Sales Ratio, is a metric that shows how efficiently the company is liquidating its inventory.
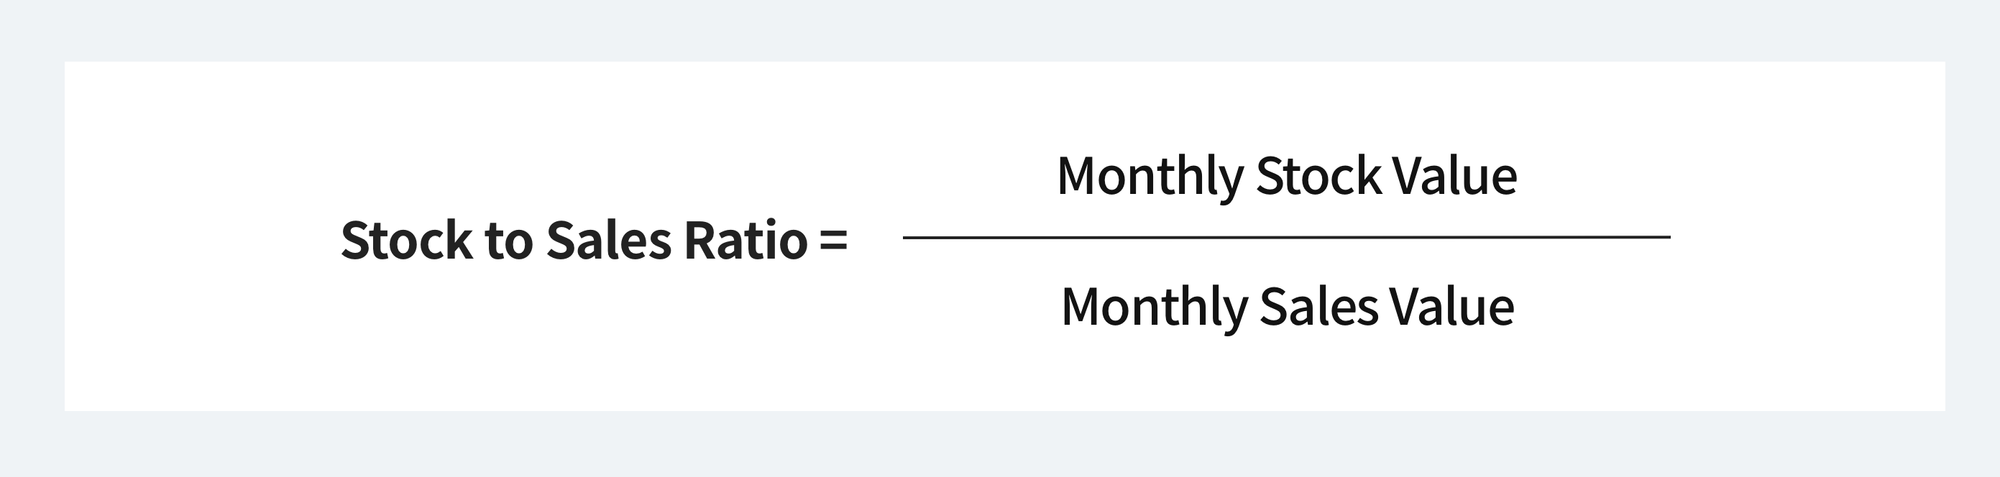
Stock-to-Sales Ratio shows that to increase inventory turnover, the business must reduce the number of stocks while increasing its sales. A good ratio to aim for is 5-10 for most industries which means that a particular item is sold and replaced roughly five to ten times a year.
Shrinkage (inventory loss/loss rate)
This KPI is used to measure the difference between paper inventory (what is recorded on paper or digitally) and actual inventory.
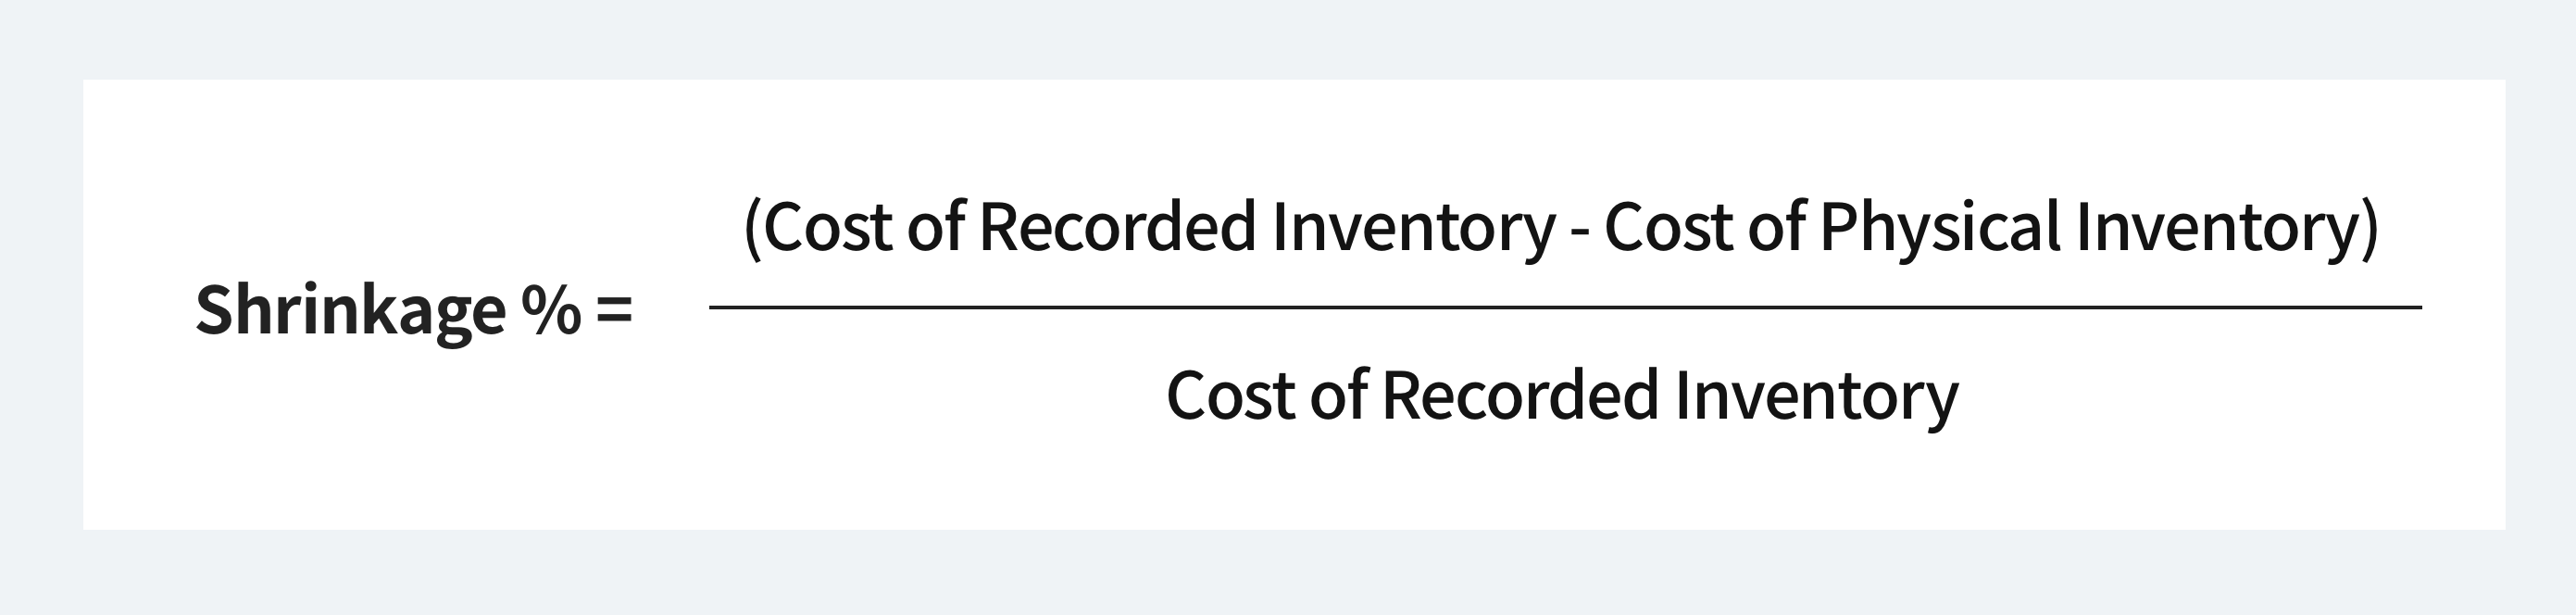
A high number suggests that there might be discrepancies in your inventory due to reasons other than typical causes. For example, if there is an issue with theft or vendor supply fraud, you will have a large difference in shrinkage and should investigate the reasons why. To conduct shrinkage analysis, a physical count of the inventory is required.
Other Metrics
- Current Quantity: Present capacity of a specific item.
- Average Quantity: Total stock in and out of products divided by the number of days in a period.
- Stock-Out Estimate in Days: Average or total amount of days taken for inventory to stock out.
- Total Stock-In Quantity: Number of items inputted as stock-in for that product during the particular time frame.
- Average Daily Stock in Quantity: Total amount of stock-ins divided by the number of days in a period.
- Average Daily Stock-Out Quantity: Total amount of stock-outs divided by the number of days in a period.
Try BoxHero and find out how easy inventory management can be!
- 📜 Categorizing items to easily sort and group based on characteristics.
- ✔ Check the reordering status from the 'Analysis' menu.
- 🔎Identifying products with 'Low Stock' status and plan reorders
- ║▌Generate, scan, and print Barcodes all in one system.
- 🧾 Easily create Purchase Orders, invoice statements, and sales analysis.
- ☁ BoxHero is a cloud-based inventory management system that allows you to create and share transactions with your team anytime, anywhere.