Demand Forecasting Methods for Inventory Optimization
Establishing optimal inventory levels is crucial for companies to achieve operational excellence and profitability. The companies need to forecast demand and find the appropriate reorder point for their inventory. This blog presents two effective methods of demand forecasting to optimize inventory.

Effective inventory management is a complex process that requires ongoing assessment of supply and demand factors affecting inventory levels. Economic shifts, inflation, and pandemics like COVID-19 can all disrupt consumer sentiment and cause supply chain disruptions. Additionally, the emergence of e-commerce environments has made it challenging to maintain stable demand through loyal customers.
Neglecting inventory management is not a viable option for businesses aiming for profitability and minimal losses. To achieve these objectives, companies need to predict demand, examine multiple factors, and establish ideal inventory levels. For companies striving for efficient operations, inventory optimization is a crucial step.
Optimizing Inventory Level with ABC Inventory Analysis

Inventory optimization involves predicting demand to find the appropriate inventory level. However, determining the right level can be challenging. Excessive inventory may lead to holding costs, whereas insufficient inventory may result in stock-out costs. Managing excess inventory may require selling it at a steep discount or disposing of it at a cost, which could result in financial losses and potential brand damage.
Accurately predicting demand is crucial for effective inventory optimization. Companies use past data from previous product sales to determine the appropriate inventory level. The most commonly used methods for predicting demand based on past data are the ABC inventory analysis and reorder point formula.

Companies that sell products rarely achieve significant success by selling only one item. Instead, they typically offer multiple products simultaneously or frequently introduce new products to entice consumers. However, companies that sell many products and achieve high sales usually rely heavily on one or two popular products, rather than each product contributing equally to sales.
Failure to consider a product's popularity when maintaining inventory levels may result in the accumulation of low-demand products as inventory in the warehouse, while popular products may experience shortages and delivery delays. Thus, setting inventory levels based on a product's sales is critical to maintaining optimal stock levels.
The ABC inventory analysis is used to manage products that contribute to revenue differently. The method classifies products into three groups: Class A consists of the most popular products, which typically account for around 80% of sales; Class C includes products with the lowest sales, which contribute around 5% of total sales. The remaining products fall into Class B, accounting for around 15% of sales and sometimes moving to Class A or C.
Optimizing Inventory Level with Reorder Points Formula
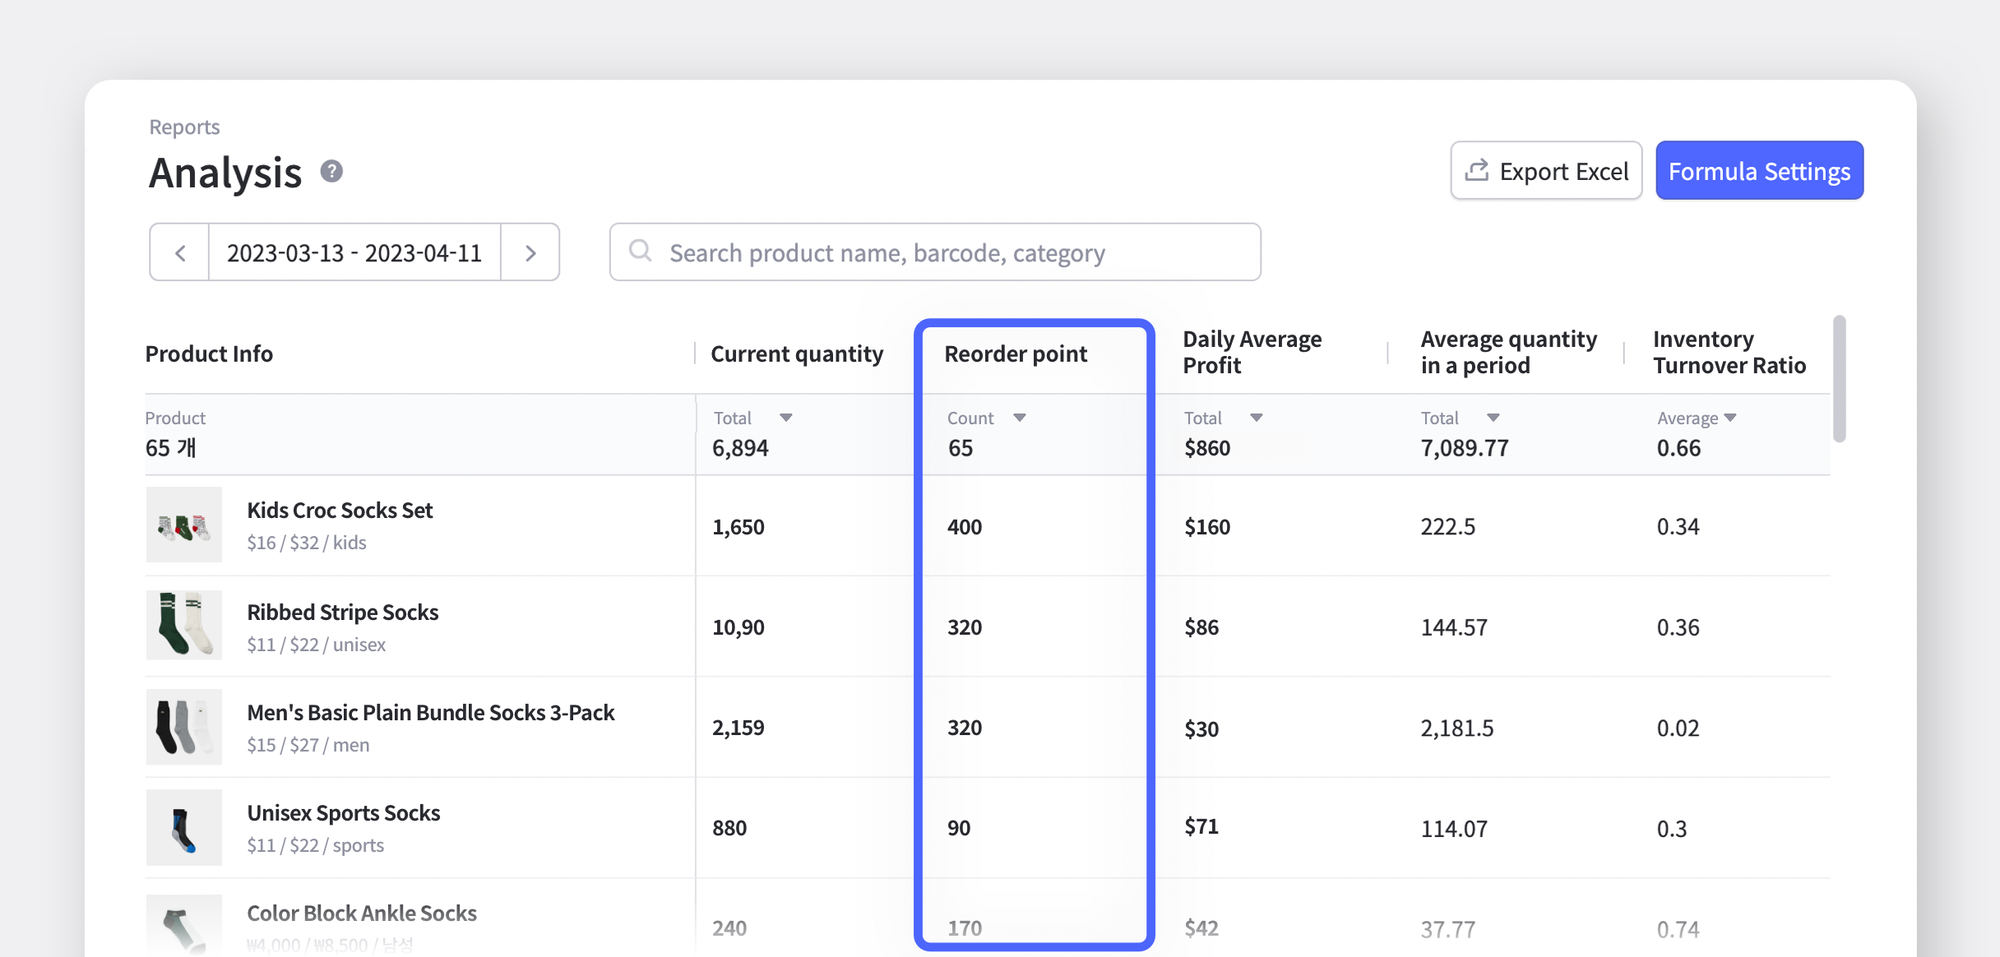
In order to optimize inventory management, it is important to determine the appropriate time to reorder products, which may vary depending on factors such as color or size. To determine the appropriate time for reordering, it is necessary to review inventory levels at regular intervals, such as once a day, every three days, or once a week, to identify the Reorder Point (ROP).

The ideal Reorder Point (ROP) is calculated with a formula that has been established over the extensive history of inventory management in both commercial and mass production. The Reoder Point formula is as follows:
Let's take an example. An apparel company wants to determine the Reorder Point (ROP) for their A-brand socks. On average, about 50 pairs of socks are sold per day. The company reviews inventory levels every three days, and it takes approximately 5 days for the socks to arrive from the manufacturer. Therefore, the Reorder Point for A-brand socks can be calculated as follows:
Therefore, if the inventory level of A brand socks falls below 400, the company can place a reorder to ensure an appropriate inventory level. However, there is a point to note when using the reorder point formula. The demand for the product must be relatively stable. In case the demand fluctuates due to external factors, setting a fixed reorder point is not feasible. In such cases, it is better to add safety stock to the basic formula to prevent stock shortages.
(Conservative)
BoxHero's Reports > Analysis feature enables easy access to past data required for inventory optimization. Users can also leverage the weekly report, which is sent to all BoxHero users, to help optimize inventory levels. The weekly report provides a comprehensive view of the inventory status for the week, including unpopular products that have not been shipped in the past month and low inventory turnover products. Start using BoxHero today to maximize inventory management efficiency and implement inventory optimization.